2020 China Climate Bulletin: above normal temperature and precipitation
Source: China Meteorological News Press
Date: 2021/02/18
In 2020, both China’s annual mean air temperature and precipitation were above normal, according to a new update from 2020 China Climate Bulletin which was released by China Meteorological Administration (CMA) On February 9, 2021. The annual mean air temperature and precipitation were the eighth and fourth highest respectively since 1951. In general, the disasters caused by rainstorm and flood were more serious than those by drought. In summer, the southern China experienced the most severe flood with extreme heavy rainstorm since 1998. Regional and periodic drought brought slight impacts and losses. The reversal of season from spring to summer was earlier than normal. High temperature occurred earlier than normal with extreme intensities, and lasted longer than normal in summer over the south of China. The numbers of landing typhoons were less than normal, while the periods and regions impacted by typhoons were concentrated. The cold air process influenced widely and brought huge decrease of temperature in local areas. Mean air temperature
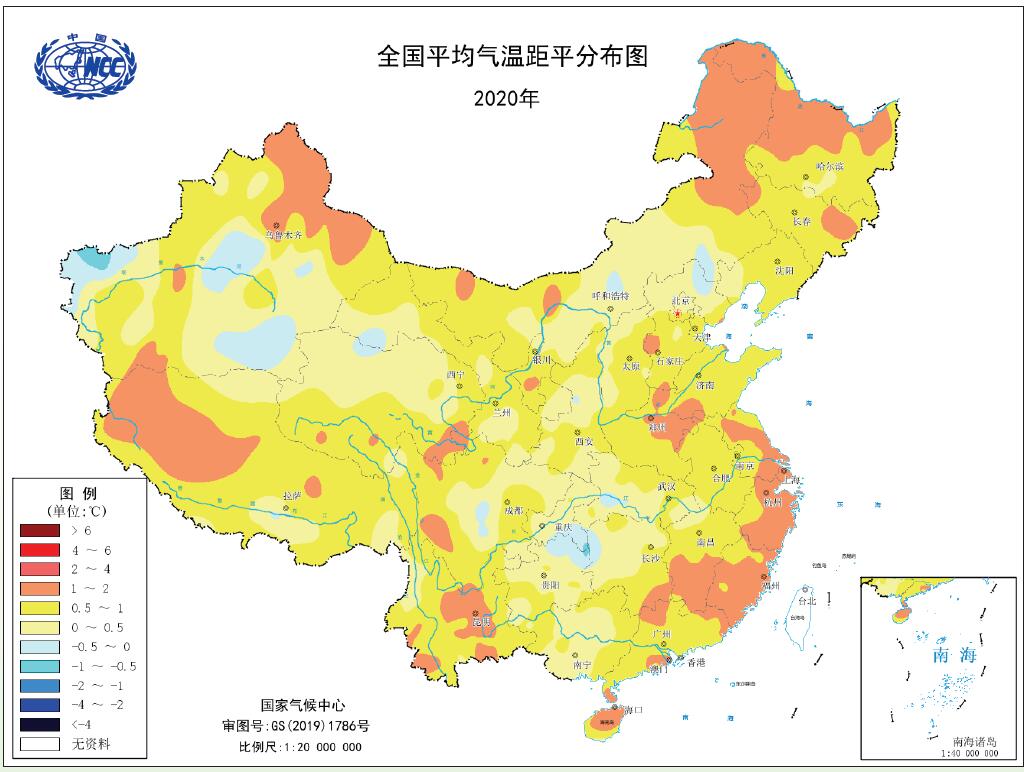
The mean air temperature of 2020 The annual mean air temperature was the eighth highest since 1951. The annual mean air temperature in 2020 was 0.7℃ above the normal of 1981-2010. The temperatures in all the four seasons were above normal and obviously warm in winter and spring. Mean precipitation
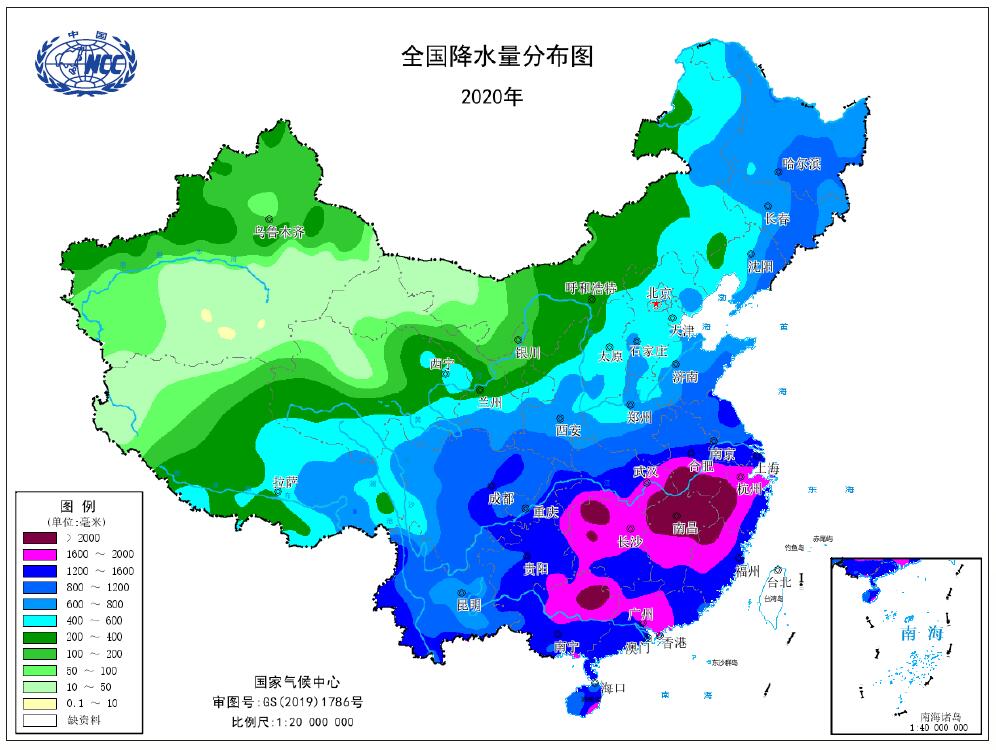
Changes in average precipitation over the year of 1951-2020 The annual mean precipitation in China was 694.8mm with 10.3% above normal, was the fourth largest since 1951. The seasonal precipitation in winter, summer and autumn was above normal, while that in spring was below normal. The regional annual precipitation was above normal in Northeast China, the middle-lower reaches of the Yangtze River, North China, Southwest China and Northwest China, but below normal in South China. The Songhua River and Yangtze River Basin had the most precipitation since 1961.
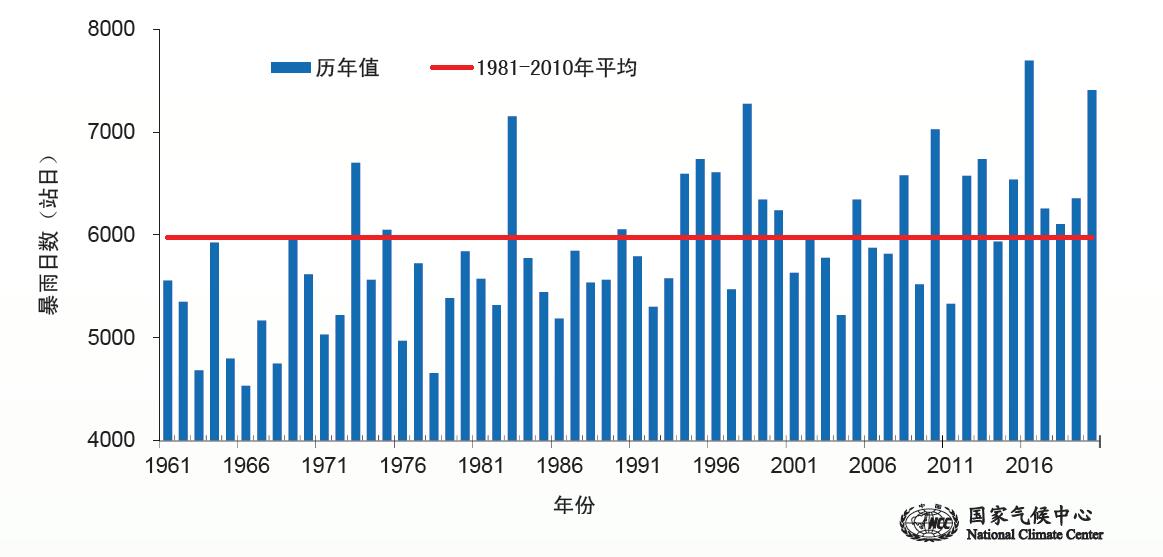
The precipitation of 2020 Rainstorm In general, the disasters caused by rainstorm and flood were more serious than those by drought. In 2020, there were 37 regional rainstorms over the country. The southern China experienced the most severe flood with extreme heavy rainstorm in summer since 1998. On March 25, 2020, the country entered the major rainfall period, 12 days earlier than normal.
Changes in rainstorm days over the years of 1961-2020 The Meiyu season started from May 29, earlier than normal and ended on August 2, later than normal, which brought about tremendous precipitation ranking the first highest since 1961. Regional and periodic drought
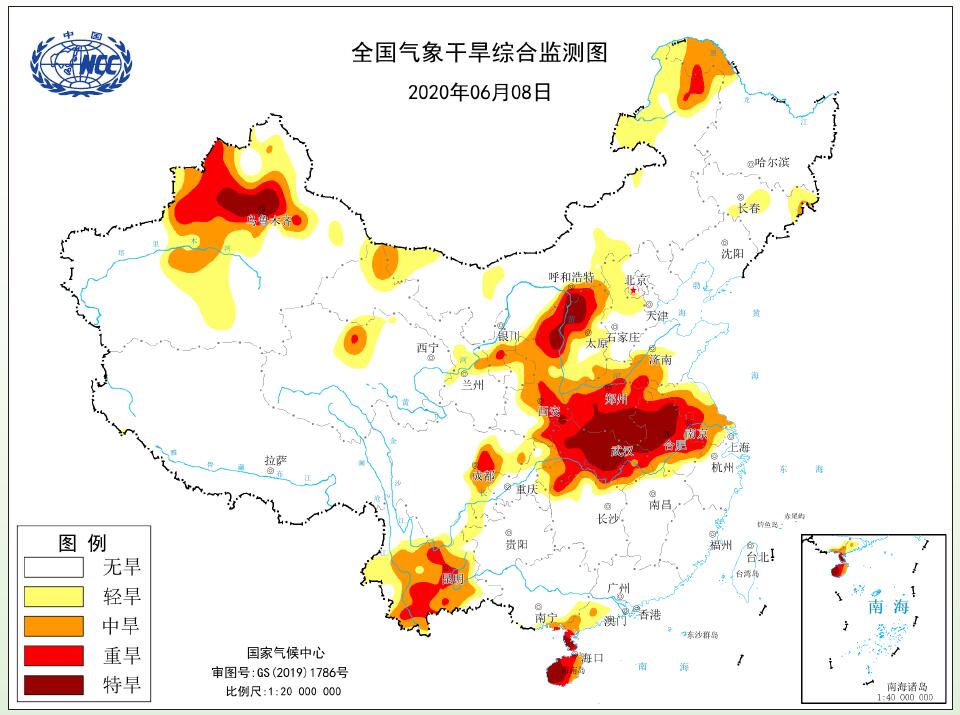
Drought monitoring on June 8, 2020. Regional and periodic drought brought slight impacts and losses in 2020. From mid-April to early summer, there were periodic droughts in many areas of north of the Yangtze River. In spring and summer, parts of the Southwest China experienced meteorological drought, northeast and southern China encountered severe summer drought. In autumn and winter, South China and South of the Yangtze River experienced meteorological drought, which brought adverse effects for agricultural production and water storage of parts of Zhejiang, Fujian, Guangdong, Jiangxi and others. Typhoons
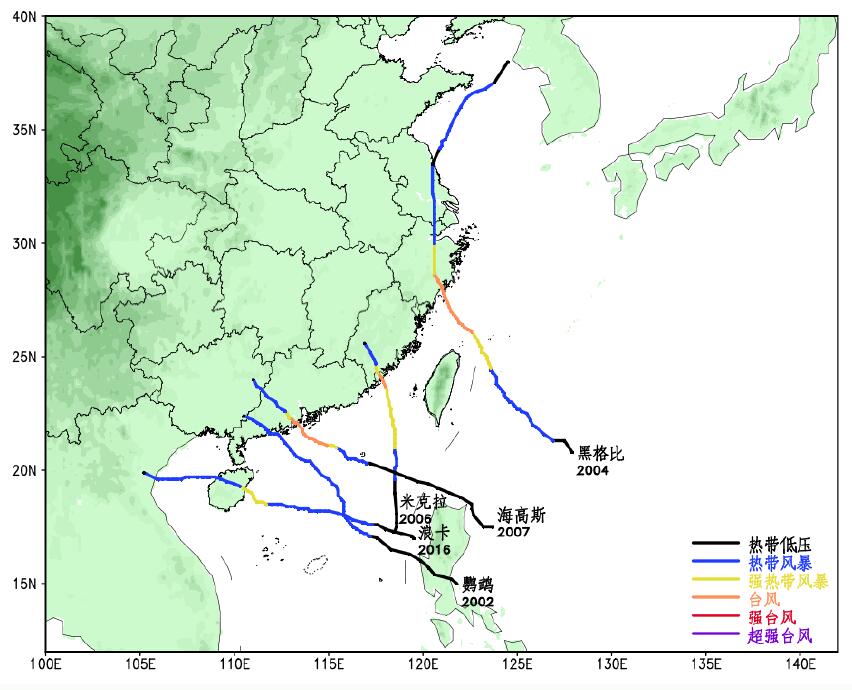
Landing typhoons track in China in 2020. In 2020, the numbers of landing typhoons were less than normal, while the periods and regions impacted by typhoons were concentrated. There were total of 23 typhoons generated in the Northwest Pacific and South Sea, and 5 of them landed in China. July was the first "zero typhoon" since 1949. From late August to early September, the Northeast China experienced severe Typhoon Bavi, super Typhoon Maysak and super Typhoon Haishen, the rare triple-hits, was the first ever seen since 1949. In 2020, the climate conditions during the growth period of main grain crops in China were generally favorable, which was conducive to agricultural production. The amount of annual precipitation resources in China was 6,592.65 billion cubic meters, which was 616.33 billion cubic meters more than normal and ranked the third most since 1961. Influenced by the anomaly high temperature, the energy consumption in the north during winter was lower than normal, while the energy consumption for cooling in summer was higher than normal. Climate conditions were conducive to vegetation growth, and the national averaged normalized difference vegetation index (NDVI) in the growing season was the second highest since 2000. Editor Hao Jing Previous issues
|